Data Knowledge Graph
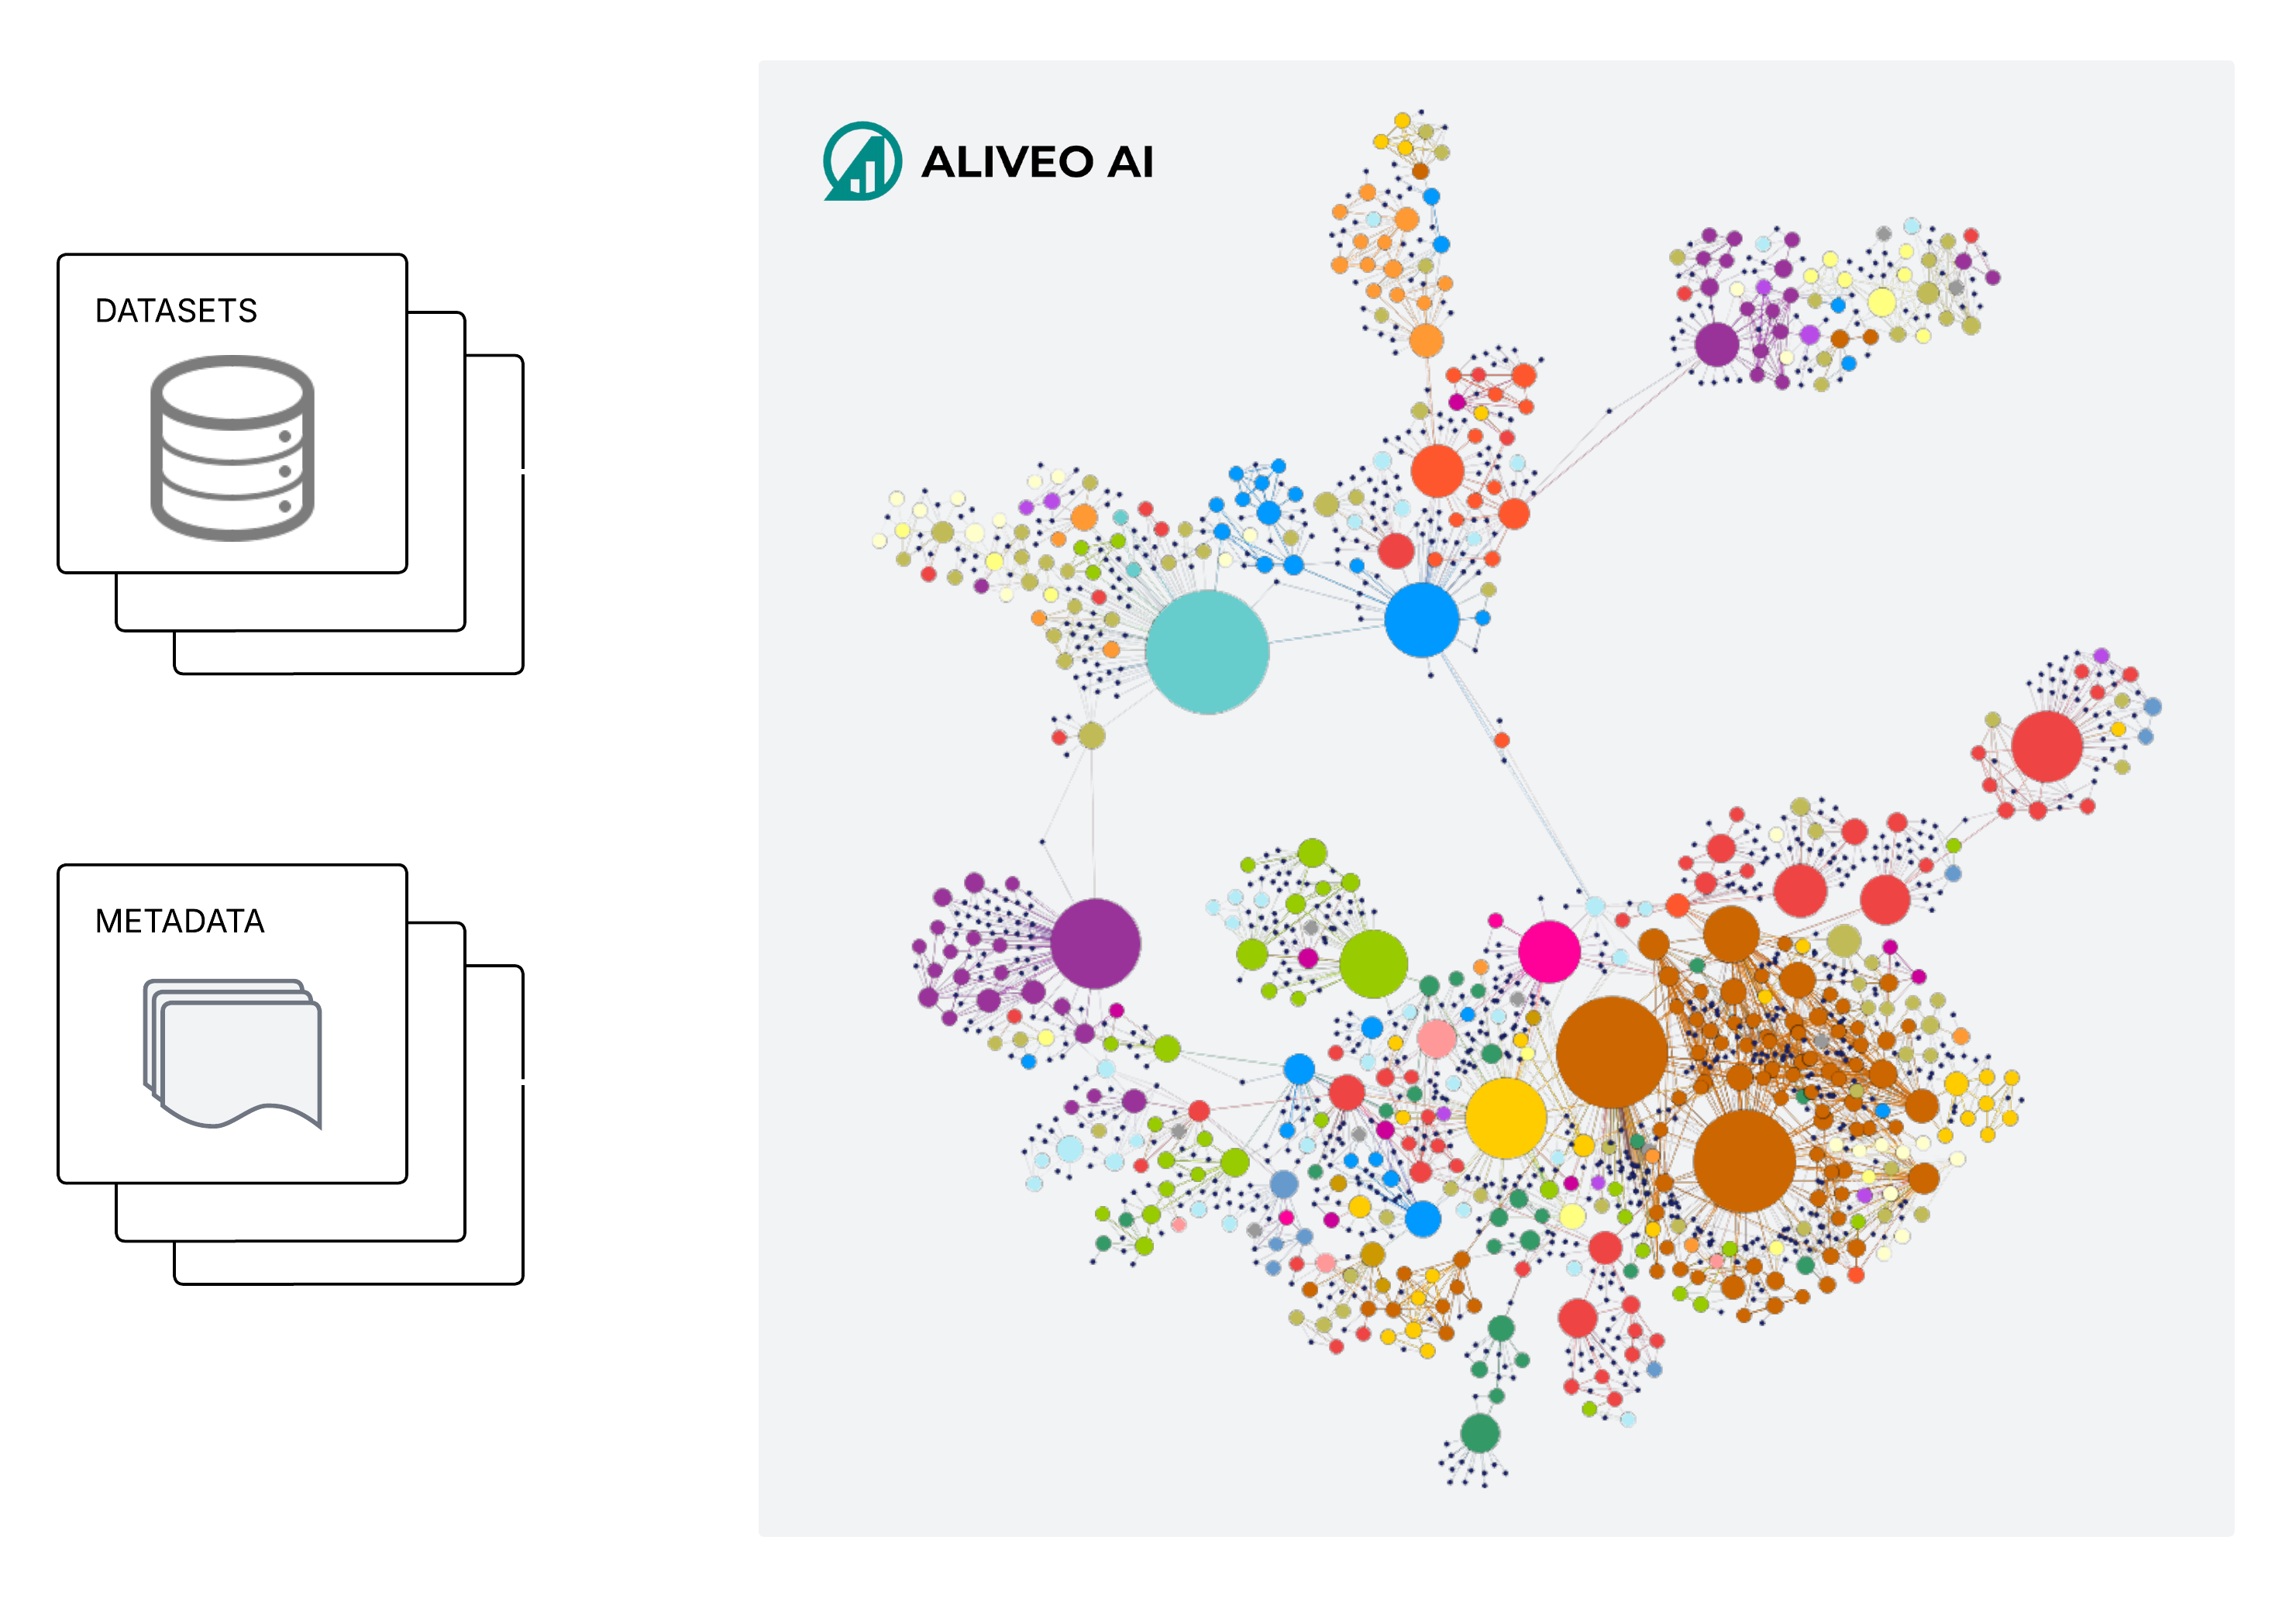
At Aliveo AI, our Data Knowledge Graph (DKG) connects raw data, metadata, historical insights, and business concepts in a single graph. Instead of just listing tables and columns, we capture relationships and deeper meaning to enable faster analytics, automated reasoning, and context-aware insights.
Data
Each internal table or document becomes a node in the DKG, with schema definitions, data types, and constraints parsed automatically. We normalize names by mapping columns and tables to canonical business concepts, then link internal nodes to Platform Data (third-party or industry datasets like market indices or demographic benchmarks). Platform Data is ingested as augmentation nodes, aligned to internal measures (e.g., ROAS mapped to KPI) via entity resolution, and connected through edges such as “benchmarks against” or “adjusted by.” Historical platform values (e.g., CPI) are tied to a client’s time series to enable comparisons—like how sales track against inflation.
Graph Construction
In the DKG, each source (database table, file, or third-party dataset) is a table/file node, with its columns represented as child nodes. We also create “Business Concept” nodes (for things like “KPI,” “Lines of Business,” or “Metric Funnels”) and “Derived Metric” nodes (e.g., “Year-over-Year Growth,” “Customer Lifetime Value”) linked by formula. Edges capture relationships:
- has_column: table → column
- is_alias_of: raw column → business concept (e.g., “conversions_iOS” → “KPI”)
- derived_from: derived metric → source columns/formula
- tags: semantic or domain labels on column/concept nodes
- depends_on: lineage links showing when one column’s values rely on another
Column Metadata Understanding
We capture rich metadata for every column: raw versus cleaned names, data types (VARCHAR(50), DECIMAL(10,2)), and constraints (PRIMARY KEY, NOT NULL). We parse comments or dictionaries to populate descriptions, detect units (e.g., “USD,” “Percentage”), and record source lineage (file paths, schemas, API endpoints). Data quality metrics—completeness (non-null rate), uniqueness (cardinality), consistency (pattern conformity), and freshness (last update)—are computed automatically. Each column is flagged by semantic role (e.g., primary key candidate, foreign key candidate, measure vs. dimension). Storing these details in the DKG supports automated governance, impact analysis, and lineage tracing across the ecosystem.
Metric Understanding
Every numeric column is classified by its aggregation type: sum (Sum Metrics such as “Revenue,” “Quantity_Sold”), mean (Mean Metrics like “Customer_Satisfaction_Score,” “Response_Time”), or ratio (Ratio Metrics like “Conversion_Rate,” “Profit_Margin”). When multiple columns feed a business calculation, we create a Derived Metric node with a human-readable label, a standardized formula (referencing the column nodes), and business context. For example, a “Year-over-Year Growth (%)” node might store:
{
    "name": "Year-over-Year Growth (%)",
    "formula": "(current_year_value - previous_year_value) / previous_year_value * 100",
    "description": "Percentage change in metric from the previous year to the current year.",
    "source_columns": ["current_year_value", "previous_year_value"],
    "tags": ["#KPI", "#Growth"]
}
derived_from edges to Revenue_CurrentPeriod and Revenue_PriorPeriod. We also weight edges based on usage in dashboards or models, so frequently used metrics surface first.
Beyond Metadata: Deep Content Analysis
Rather than stop at names and types, we inspect each column’s contents. We calculate distributions (unique counts, histograms), flag outliers (e.g., negative sales), and apply regex and statistical checks to detect patterns (like date or ID formats). If 95% of values match a YYYY-MM-DD pattern, we suggest a “date” data type. This layer fuels historical statistics, semantic tagging, and metadata enhancements by revealing insights hidden below the surface.
Historical Statistics
For every numeric or temporal column, we generate time-series profiles at daily, monthly, and quarterly intervals, tracking sums, means, minima, and maxima. We detect trends (e.g., a 5% quarterly rise in average order size), identify seasonality (holiday sales spikes), and compute moving averages, year-over-year changes, and rolling standard deviations. Abrupt shifts—like a sudden traffic drop—are caught by change point algorithms and surfaced as alerts. We also log data quality metrics (nulls, zeros, extreme values) over time, allowing teams to trace issues and spot anomalies (e.g., “Daily Revenue” 30% below historical median).
Understanding the Semantics of Column Values
Instead of treating columns as black boxes, we analyze their values directly. Regex matching (such as tagging a column as “ZIP+4 Code” if 95% of entries match that format) lets us assign data-type tags (“Currency,” “Percentage,” “Geo-Identifier”). For free text (e.g., “Product_Category”), we compare against taxonomies or company dictionaries; for descriptions, we run named-entity extraction to pull out organizations, locations, or dates. We generate embeddings to cluster text values (e.g., grouping “Top of Funnel”, “Middle of Funnel”, “Bottom of Funnel” product strategies). Cardinality profiling distinguishes high-cardinality IDs (like “User_ID”) from low-cardinality categories (like “Country”), and outlier detection flags unexpected values. All semantic insights become edges connecting column nodes to concept/tag nodes, enabling tasks like semantic search and automated reporting.
Tagging and Clustering
To simplify discovery, we assign multi-level tags and clusters to columns. Tags include business domains (e.g., #Finance, #Marketing), data types (#Numeric, #Temporal), semantics (#Currency, #Percentage), and inferred campaign attributes. For campaign-related data, we parse campaign names to extract tags such as location (e.g., #US, #EMEA), optimization type (e.g., #CPA, #ROAS), campaign type (e.g., #Brand, #Performance), and more. We then use hierarchical clustering on semantic embeddings to form nested clusters (for example, Unit_Cost + Unit_Price → Pricing Metrics). We will soon have interactive UIs—such as tag clouds and dendrograms—help users explore these clusters, which update automatically as new data sources (including new campaign naming conventions) arrive. We support both manual tagging and automated suggestions based on column content, historical usage, and semantic relationships.